
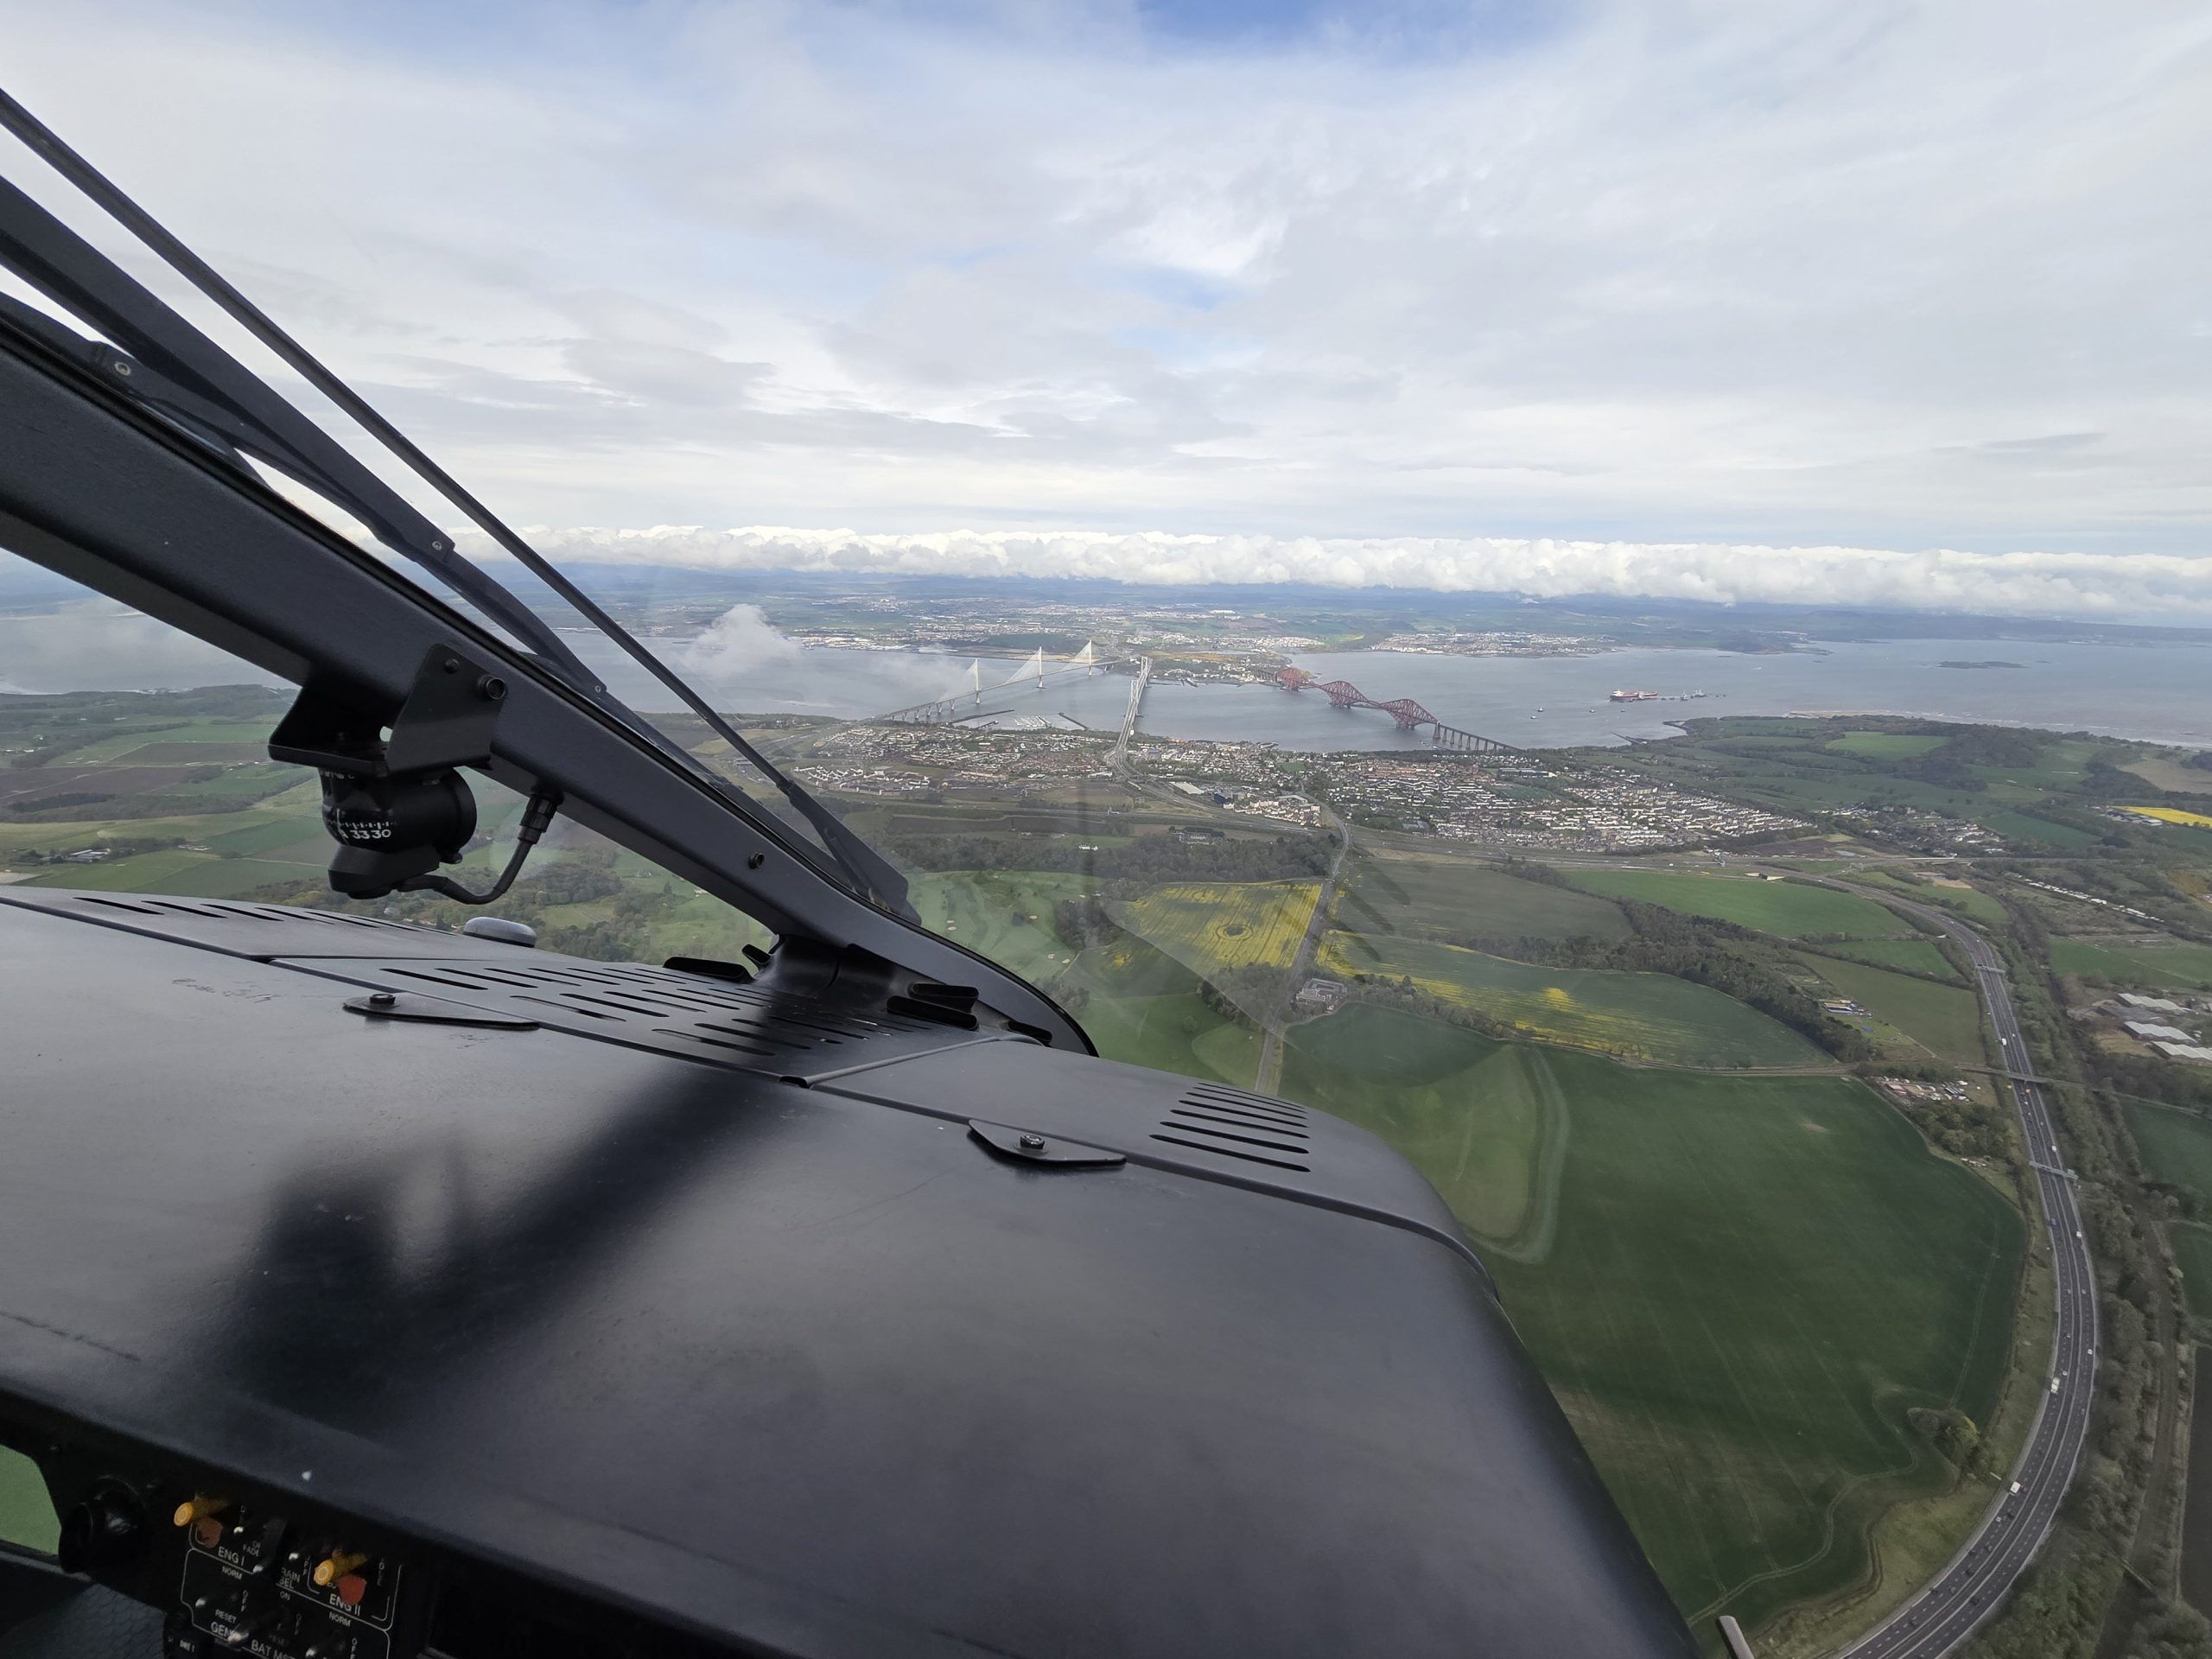
On some instrument approach charts there is a choice of approach minimum altitudes dependent on the climb gradient in the go around phase. In this article we look at why different gradients make a difference and how pilots can use the performance manual to select the right minimums for their approach. We focus on helicopters but much of it applies to aeroplanes too.
Let’s get stuck in.
Contents
An example
Let’s start with an example. The airfield at Shoreham (EGKA) is located on the south coast of the UK and a ridge sits to the north. Look at the approach for the 02 runway (towards the ridge). Look at the minima section:
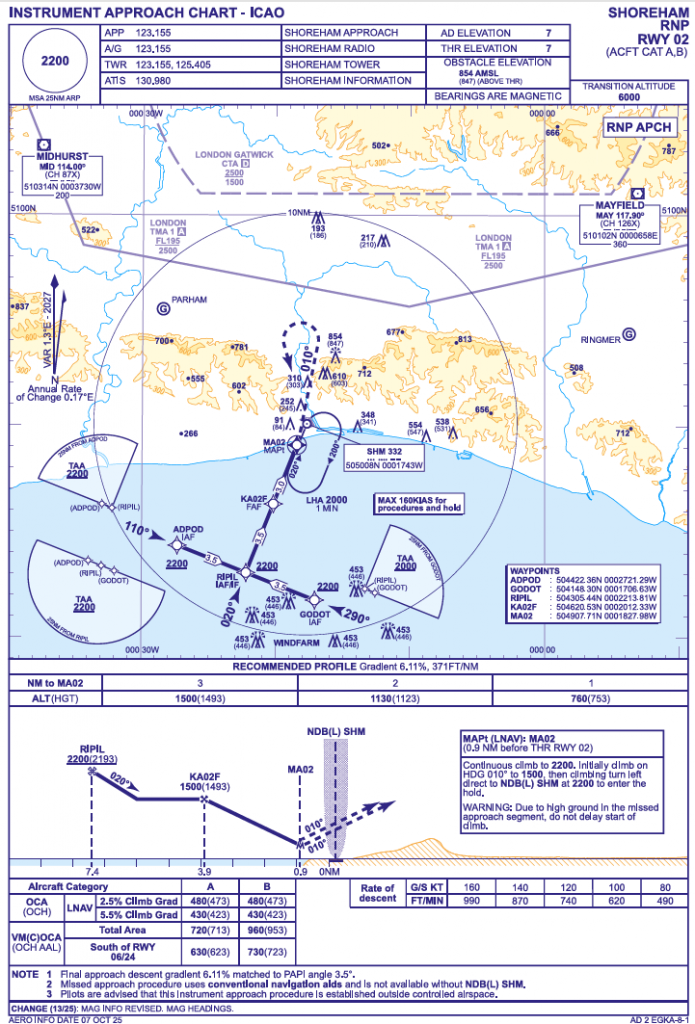
First note that, unlike nearly all other RNP LNAV missed approach points, the one here is not at the threshold of the runway. This is crucial to note as it directly affects the climb gradient calculations.
In any case, let’s look closer at the minima (note as this is from the AIP, the minima are actually Obstacle Clearance Altitudes (Heights) OCA/OCH not MDA. You need to follow the relevant procedures to calculate your MDA – for example for UK Commercial Air Transport (CAT) operations, the rules are in CAT.OP.MPA.110. As it happens the UK CAA/EASA procedures give an MDA that is equal to the OCA/OCA so we will use these.
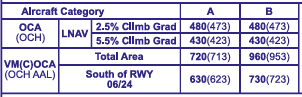
From the table, if we can climb at a steeper gradient we can have a lower minima. How does that look?
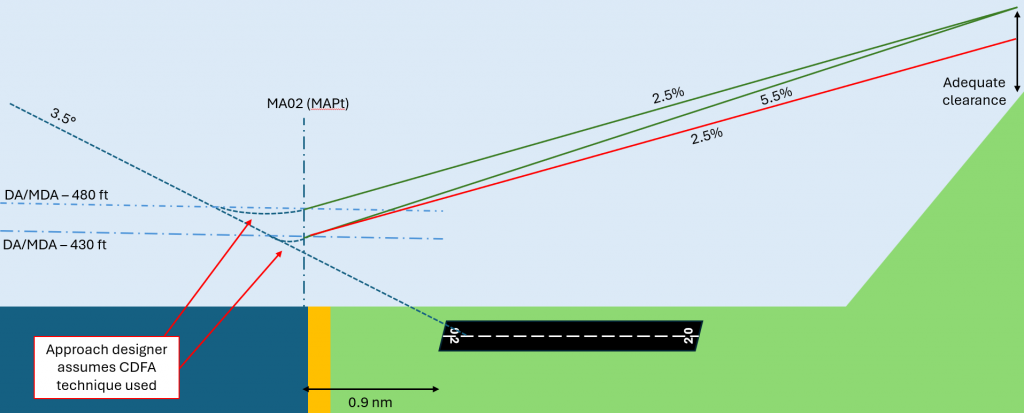
From the diagram we can see that the approach designer has chosen 2 different climb gradients and each achieves the necessary clearance from terrain during the go-around. But why percent? Why not degrees like the approach?
Why gradients?
For the reasoning behind the use of gradients, we need to understand a little of performance and a little of approach procedure design.
Performance
When we look at performance in the go-around, it is all about terrain/obstacle clearance. We need to assure ourselves that we are not going to get perilously close to the terrain or obstacles in the departure path. At a place where we might operate under IFR, we will likely know the position and elevation of any obstacles in the departure path. We then need to be able to calculate the position of our aircraft, to determine the clearance.

First we need a starting point. For the sake of this discussion, our starting point is the Missed Approach Point (MAPt). We know exactly where this is in space. From there we need to calculate the subsequent flight path of our helicopter. For that we need a gradient not an angle – hence percent not degrees for the departure flight path.
Using published data
Looking through a helicopter manual, you may not find a nice chart which gives a climb gradient for a particular set of conditions. For most helicopters, what you will find the performance section of the Rotorcraft Flight Manual (eg Section 5 for Airbus Helicopters) is a chart showing Rate of Climb at particular power settings at particular airspeeds in knots. Here is an example. This is for an EC135 T2. It shows Rate of Climb in feet per minute at VY which is 65 kts on EC135 T2.
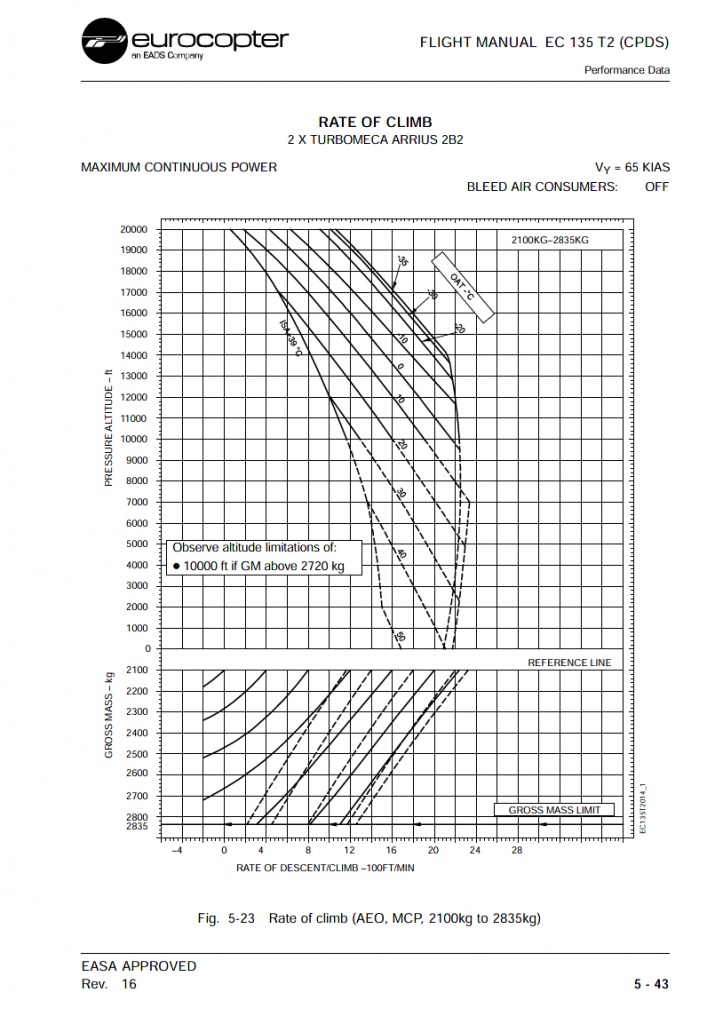
Nearly the right data but not quite. How can we get a gradient from a rate of climb?
Some maths
A gradient in this circumstance is:
So we have a vertical distance in one minute, but we need horizontal distance in a minute (in the same units!). So we have our airspeed – 65 kts. One nautical mile is 6080 ft. So a little maths later and in one minute we have 6586 ft. So let’s plug some data in.
For an EC135 T2 at maximum weight (2835 kg), operating at sea level (Shoreham) on a hot summers day (30C), the rate of climb from the chart is 1180 fpm. We will assume no wind as what we actually need is groundspeed not airspeed. So:
So with both engines working, we can climb at 17.92%. So we comfortably exceed the minimum gradients we saw earlier. That was quite a laboured way of calculating that result. Could we simplify it?
Some simpler maths
One thing to note, is that when we converted our groundspeed in knots to a horizontal distance in feet in one minute, the original speed was still there in the numbers (65 kts becomes 6586 ft per min). Also note the output is roughly times 100. We can use this to make a rough rule of thumb (with a little rearrangement):
Let’s feed in our approach. We need to make 5.5% gradient to use the lower DA/MDA.
This compares against the accurate number of:
That approximation will do. We have established under a pretty normal summer day in the UK, we comfortably exceed this minimum climb gradient for the Shoreham instrument procedure. However, this is will the aircraft working well. We have to consider what happens when it goes wrong.
Having a bad day
We have to consider what happens if we lose an engine; that is the basis on which manufacturers certify the aircraft. However, if you poke around the main section of the Rotorcraft Flight Manual, there is no data for performance in the climb with one engine inoperative (OEI). For that we need to look at the Category A section, which is usually a Flight Manual Supplement.
Let’s look at the same aircraft we looked at earlier, the EC135 T2. For the T2 the performance of the aircraft is broken down into several sections of the departure.
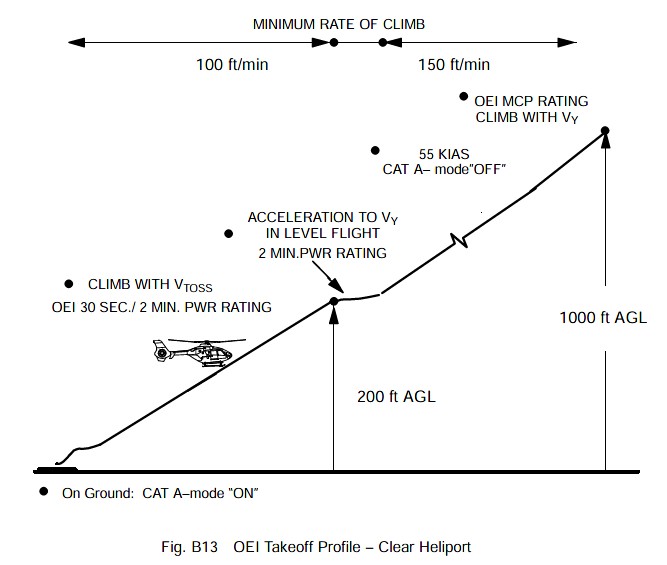
Getting the right chart
In our circumstances, since we are going around from MDA, we are already above 200 ft, so it is the performance information from 200-1000 ft that we need.
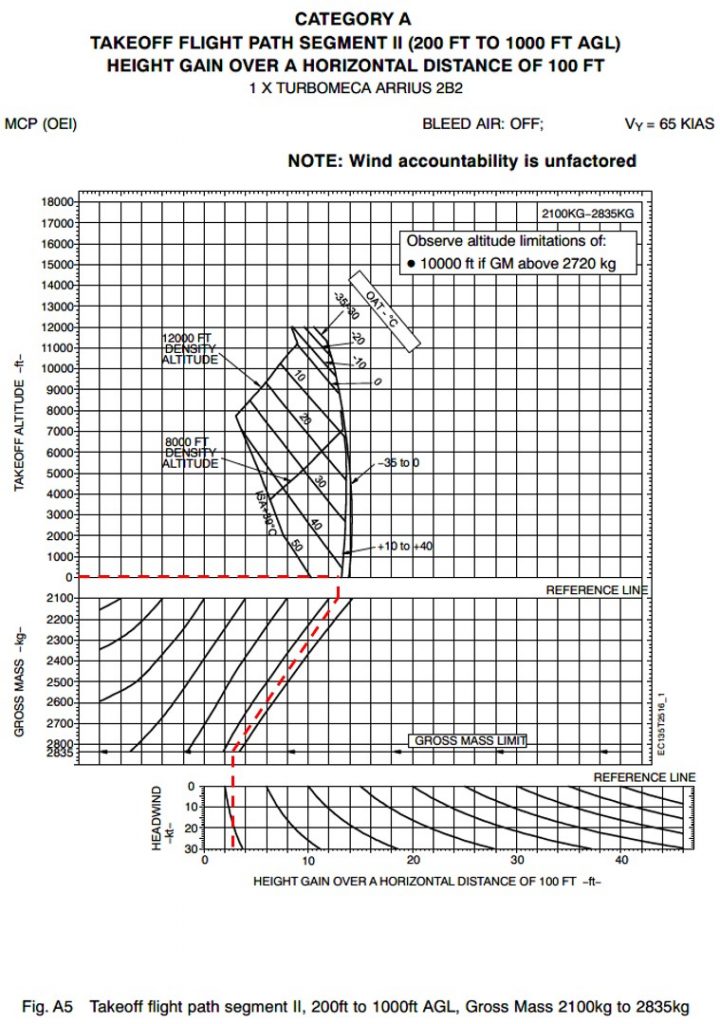
Let’s take the same aircraft parameters we used earlier. An EC135 T2, 2835 kg at Shoreham on a hot day (30 degrees C) at sea level on a still wind day. The result is 2.5 ft height gain over a horizontal distance of 100 ft. 2.5/100= 2.5%
So we can just make the 2.5% but not the 5.5%. So we must use the higher MDA for the approach! We have used maximum weight here (typical for an operator trying to minimise the calculation burden) but that would actually be impossible at the end of an approach; if we are max weight at the end of the approach we must have been overweight before that! So we might expect slightly better performance.
But wait, it’s more complicated than that.
Dirty aircraft
The performance figures given in the Flight Manual are typically the figures for a clean “standard” aircraft. If a modification is embodied which alters the drag or performance of the engines, this must be accounted for. Let’s imagine we have the flotation gear fitted on the skids.
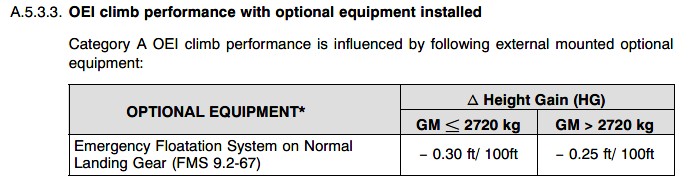
This reduces the height gain by 0.25 ft/100 ft (or 0.25%) in our conditions. We were at 2.5% so with flotation gear we are at 2.25% and we cannot do the approach at all! If a modification is embodied from someone other than the manufacturer, this data will be in the relevant Flight Manual and is determine via flight test methods.
Reverse engineering
We can of course do a little reverse engineering with the charts and determine the maximum mass for the 5.5% option. We could then relate that to a fuel load for us to make an easier calculation in flight.
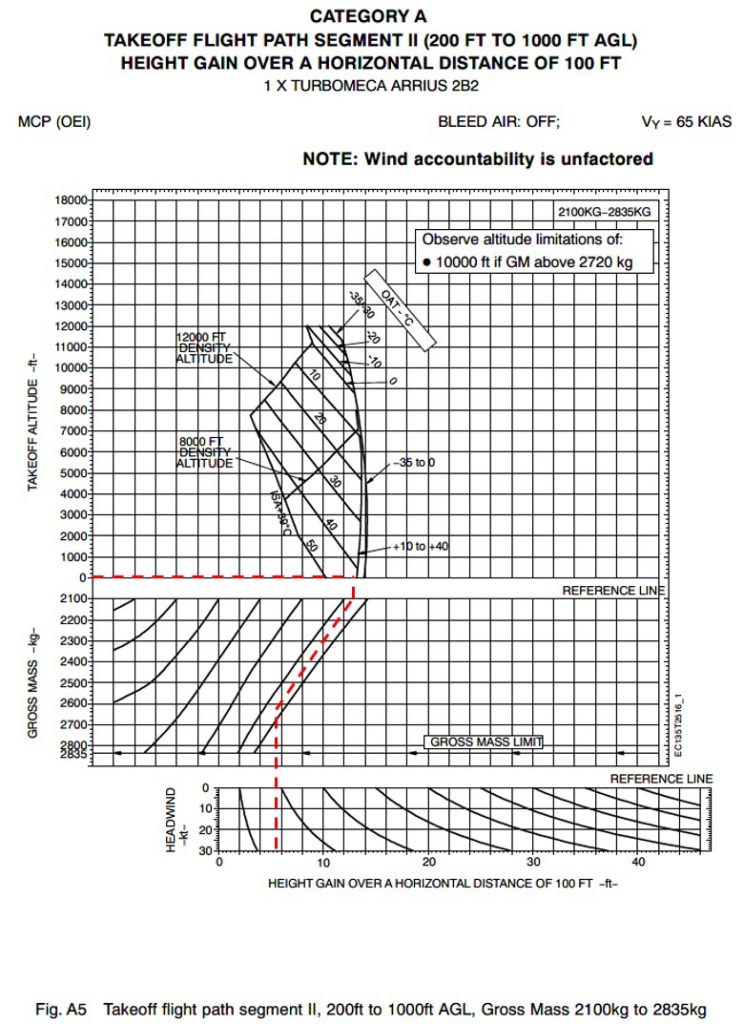
From the chart above, the maximum mass on our hot day at Shoreham is only 2620 kg to achieve 5.5% and therefore to allow use of the lower MDA. The chart is for maximum continuous power and the 2 min rating might be available but there is no data to support this so we cannot consider it.
Charts without a gradient
Well that’s all very nice, but what about a minima where no gradient is provided. What is the norm?
The source document for this nugget of knowledge is ICAO PANS OPS. The ever helpful Swiss provide access here. In Vol 1 of PANS OPS, it states at para 7.1.9:

Ah, OK, that’s where 2.5% comes from! It’s the norm.
Or is it the norm?
Category H is different
In accordance with the regulatory reference we mentioned earlier (CAT.OP.MPA.110), helicopters may have a different minima applied to an approach because helicopters can fly slower (and so theoretically climb more steeply). However, there is a sting. Let’s look at Vol 1 of PANS OPS again and read on a little:

So unless stated otherwise, we need to be able to achieve 4.2% if we are using Cat H alternate minima. You need to study the chart very carefully! If you calculate you cannot achieve 4.2% when OEI you cannot use Cat H minima. Typically these are provided on a separate page by major providers (eg Jeppesen).
Standard Instrument Departure (SID)
We also need to consider SID; they have gradients too.

The standard can be modified as described above at para 2.2.2. For example a Perth SID from Glasgow requires a 4.5% climb gradient to 2000. The aircraft is likely to be heavier at this point in a sortie. Our poor EC135 could not achieve this on a hot day!
Summary
Let’s have a quick review. We had 2 options for our minima on this approach to Shoreham – 480 ft for 2.5% gradient and 430 ft for a 5.5% gradient. As has been shown, the achievement of these gradients, even the lower one is not a given for helicopters and does need to be calculated.
The rule of thumb is helpful, but a pilot does need to dig into the right chart to the answers needed:
Could you get the right chart out in a reasonable time in flight to work this out? Have you worked out the achievable gradient OEI for that SID you just selected?
Time to get your nose in the books.
Now read some more!
- FSTD Capability Signatures (FCS) – A hidden threat for training?

- Preparing for complete loss of engine power in helicopters
- Lessons in how to manage a helicopter engine malfunction
- Light twin helicopter AFCS – Have Airbus won the race?
- Maintenance by pilots – can the training be improved by sharing?
- Flight simulation revolution – A new method for matching training need to simulator capability
- Helicopter Single Engine IFR – New horizons
- Making the grade – understanding climb gradients in the go around
- Unfair Skies: Restrictive helicopter instructor rules and how to fix them
- How to create an instrument rating instructor (IRI) – A helicopter anomaly
- The evolution of Category A Helipad procedures – A strong foundation for VTOL to learn from?
- Strips vs dials – Which is better?
- Under the weather – are UK HEMS weather rules broken?
- Mastery of the GTN 750 – Ten things you should know
- Checking anomalies – The weird requirements of helicopter proficiency checks


Leave a Reply